How are data integration and data visualization solutions playing out in the real-world?
Manufacturing Data Integration Misconceptions
One common misconception about data integration is that analog processes (hand-assembly, or non-digital machinery, or even how people are moving through a factory) cannot be integrated. Nowadays, this is an incorrect assumption.
For instance, ThinkIQ, a leader in Transformational Intelligence for Manufacturers, provides a platform that visualizes and integrates data from the earliest point in the supply chain through product delivery. Their Vision product can process a video feed to determine and digitize the key actions in that video such as a user who is violating safety protocols by bending over incorrectly when lifting, or who reached through a safety gate. ThinkIQ's video analysis can sense if a safety chain is across the loading dock, read license plates in a concrete yard, record how often a machine user is replenishing their raw materials, and tell how many guitars were handmade, and much more.
That digitized video data is processed through the same semantic language models, so it can then appear in relevant visualizations as needed.
But What Data Gets Visualized And How?
Complex data — meaning, anything other than alpha, numeric, and date information — is frequently composed of multiple types of information. Consider, for example, the relationship between products produced, time, and labor-hours. This data could be a stream of independent numbers. But on the right graph, it would be easy to spot a correlation between labor-hours and products produced.
Companies which help companies attain Smart Manufacturing, Industry 4.0 status — such as ThinkIQ — usually start with the end-goal in mind. What are the key goals that a company needs to achieve? If it’s “X number of widgets produced,” then the processes and sub-processes are analyzed, and any related data points are integrated.
This leads to a custom dashboard, where at the top level a manufacturer could see their goal, but then they can dive deeper into granular data as needed. In our example, that would mean seeing a visualization of total products made — not just “this month” but at any level of granularity, from “last hour by this operator” to “compare all machines over the past year.” This is simple visualizations. It gets more interesting when viewing complex data.
Smart Manufacturing data visualizations often show a manufacturer incredibly useful data that they’ve never been able to visualize previously. Consider seeing labor hours charted with total production. That’s useful not only to show where understaffing can cause dips in production, but also where overstaffing doesn’t result in enough additional production.
Then consider how those charts might be useful when graphed with other data in your manufacturing plant, such as total electrical usage, weather patterns, delivery patterns, supply levels, machine downtime, and practically an infinite number of additional datapoints.
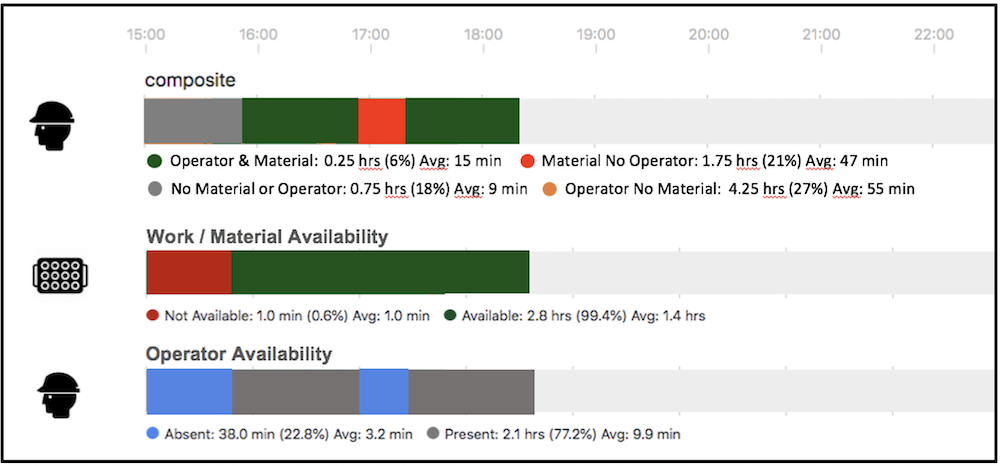
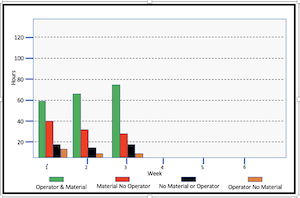
In the example shown here, ThinkIQ uses cameras to track when a machine operator is present, and when the necessary materials are available. This allows the smart manufacturer to identify work replenishment delays and dwell time, to set goals and improve over time, to maximize headcount, performance analysis, and ultimately to maximize their throughput on the line.
More sophisticated visualizations offer summary views by relevant groups, offer trends over time, and can correlate and associate data from various elements — such as material movement through welding sparks through staging — to give a manufacturing manager the total picture.
 Data integration and visualization are no longer a luxury, but a necessity for any competitive manufacturers in the era of Industry 4.0. They provide a clear and comprehensive view of the manufacturing process, enabling manufacturers to make informed decisions and improve their operations. As the examples of ThinkIQ demonstrate, smart manufacturing technologies can lead to significant improvements in efficiency, waste reduction, and product quality.
Are you ready to navigate the data maze and transform your manufacturing operations? Contact ThinkIQ today to learn how our Transformational Intelligence platform can help you leverage the power of data visualization and integration.