Remember MS-DOS computers? Show the C prompt to anyone born after 1990, and they’ll probably look at you like you’re wearing a tin foil hat. To execute the simplest of tasks on your computer, you had to know a whole language of commands. It was like asking “regular folk” to be Python coders just to binge cat memes — you know, basic computing tasks. Then one sunny day, Windows entered our lives. Files became visual. The desktop, file folders, the trash bin all became far more tangible with just a little visualization mixed into the operating system. Even though the underlying complexity still exists, the usability for everyday people was no small feat that paved the way to the digital revolution — and now Industry 4.0.
Continuous Visualization Unlocks New Opportunities
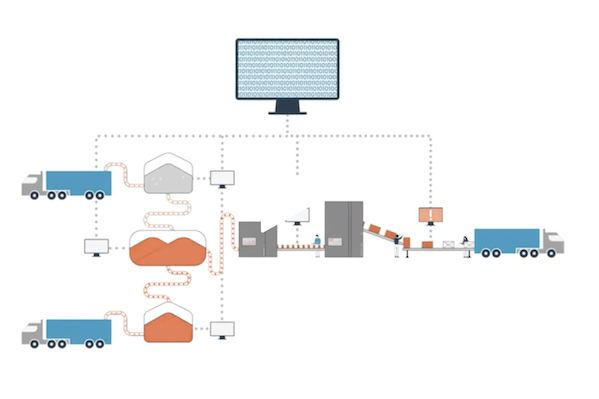
Indeed, advanced data visualization dashboards in manufacturing bridge the gap between industry as we knew it and something far more complex yet approachable, just like Windows did back at its inception. Through visualization, manufacturers are now able to see the implementation of their internet of things (IoT) devices, cyber-physical systems (CPS), and big data analytics. Accessing greater optics benefits operations managers in a myriad of ways. Not only do data analytics themselves become much more powerful, but more of the workforce is capable of grasping, and making optimal use of the patterns, relationships, and assessments they can now see. This leads to better decision making, improved ad hoc analysis, and a more collaborative manufacturing environment.
The crux of the issue in a non-visualized environment is the vast amount data being produced and few ways to understand it all. Between cloud manufacturing and the IoT devices and sensors that can be spread out on shop floors throughout the world, the amount of big data being generated and accumulated is rising exponentially. One of the most critical challenges a manufacturer faces is finding a way to wrap its arms around all these data sets so they don’t go underutilized and collected in vain. Visualization offers a user-friendly way to summarize petabytes of data quickly, which can lead to timely responses with far-reaching business impact.
Visualization, in fact, unlocks a more granular approach to manufacturing processes. And with greater material traceability across the supply chain, operations managers can diagnose and correct more inefficiencies and errors. Data from a variety of different processes can now be gathered and combined to the effect of greater analytical insight and reports in which findings are more strongly visualized. This transformation of data analysis can really expedite processes. While it may have taken a team of engineers several hours before to determine the cause of an error now can be achieved in an hour. The potential boost in productivity is immense.
Level The Playing Field For All
Visualization is really a way to humanize something that is otherwise quite abstract. It creates a path for an aging manufacturing workforce to more easily step into today’s needs. Visualization helps make retraining less daunting while lowering the bar for much of the workforce to understand and analyze large datasets and troubleshoot problems that arise.
Particularly for small and midsize enterprises, visualization is an extremely efficient way to compete against the limitless resources and expertise of larger firms. Deploying a visualization solution can really help move any business closer to full Industry 4.0 operations. Visualization transforms raw data into explorable, comparable data awareness complete with standardized metrics and views that bring wide visibility and context to what otherwise is just digital bits.
A visualization partner, such as ThinkIQ with its ThinkIQ Visualize solution, should be able to coordinate across supply chain partners to centralize existing data streams from IoT, IIoT, HMIs, PLCs, ERPs, CRM, MES, digitized manual data, and partner data, all into a single location for a cross-silo single pane of glass view. Further, ThinkIQ’s Digital Manufacturing Transformation SaaS provides a fact-based granular, data-centric contextualized view of material flows and related providence attribute data that provides unprecedented material traceability and insight into ways to improve yield, quality, safety, compliance, and brand confidence while reducing waste and environmental impact.
Taken altogether, visualization represents a nearly instant transformation in data analysis, manufacturing productivity, and overall production yields, bringing manufacturers — and the humans manning their processes — closer to the revelation of Industry 4.0.
Begin reaping the benefits of all the data you are collecting and move into the world of smart manufacturing, material traceability, and visualization. Reach out to a ThinkIQ expert today to learn more. For more information, you can also check out our ebook, “Advanced Material Traceability Revolutionizes Digital Transformation.”